Fig. 4.
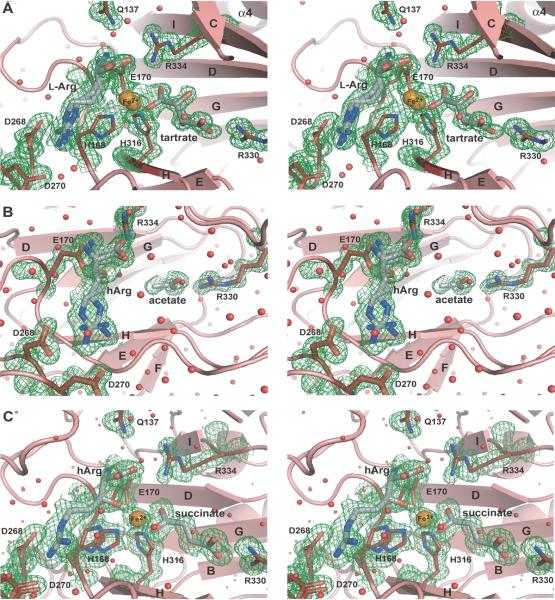
Active site of VioC. A) Stereo diagram of the active site of the substrate complex. The 2Fobs-Fcalc electron density (contouring level 1.0 σ ≡ 0.39 e−/Å3) shows the bound iron (orange), tartrate, and L-arginine (gray). Notably, the substrate L-arginine and the iron are coordinated in two different conformations with 75% and 25% occupancy, respectively. B) Stereo diagram of the coordination of hArg in the active site of VioC in the VioC•hArg complex with an overall 80% occupancy for hArg (gray), where each coordinated conformer exhibits 40% occupancy. Additionally, a fragment corresponding to an acetate ion was indicated by the 2Fobs-Fcalc electron density (contouring level 0.8 σ ≡ 0.35 e−/Å3) of the binding site of the αKG cosubstrate. C) Stereo diagram of the active site of the VioC•hArg•succinate•Fe(II) complex with iron shown in orange and hArg and succinate shown in gray. The 2Fobs-Fcalc electron density was calculated with a contouring level of 0.8 σ ≡ 0.35 e−/Å3. Water molecules are depicted as red spheres.

