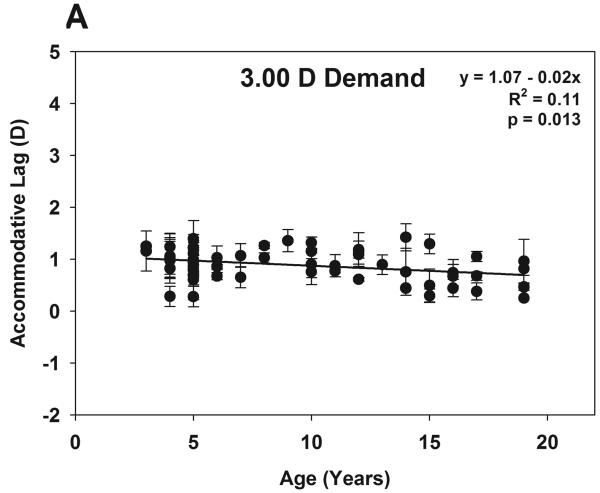
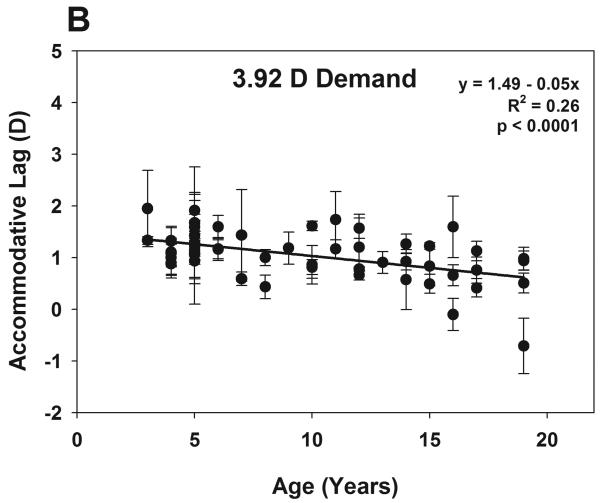
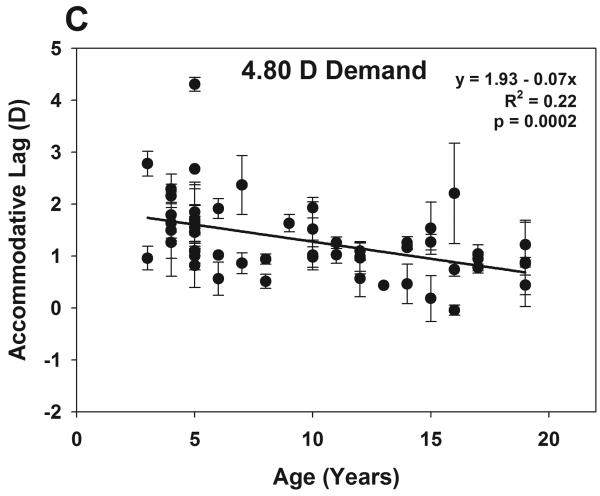
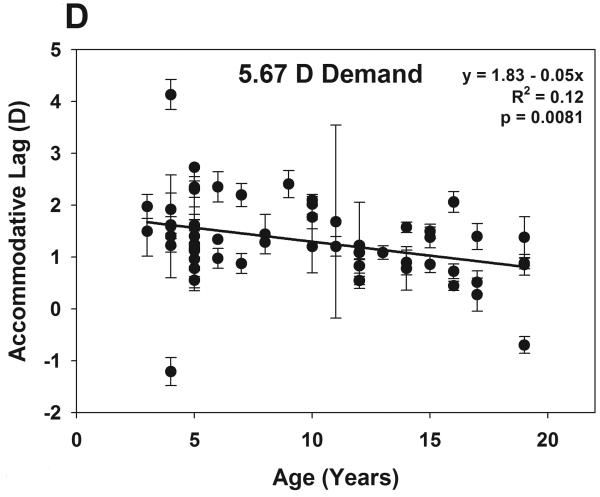
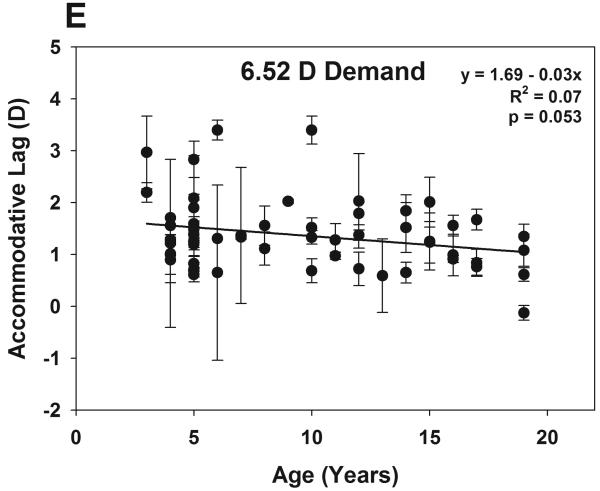
Figure 2.
Individual subjects' data (aged 3 to 20 yrs) for each stimulus demand tested (A-E). Error bars show ±1 SD for each subject for three repeated measurements. Accommodative lag showed a significant linear decrease with increasing age for the first four demands tested (p < 0.02) and approaches significance at the largest demand (p = 0.053).

