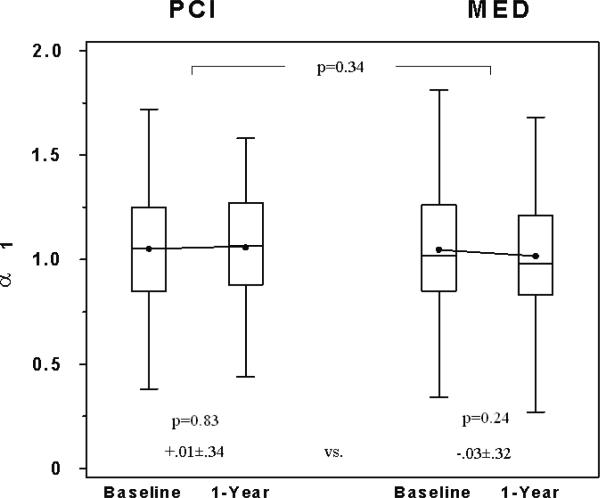
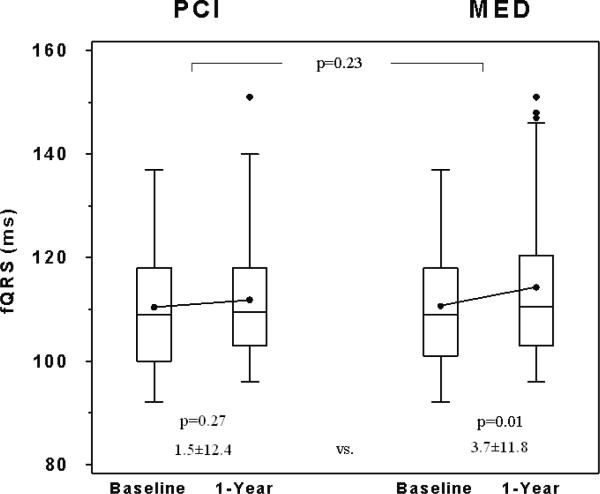
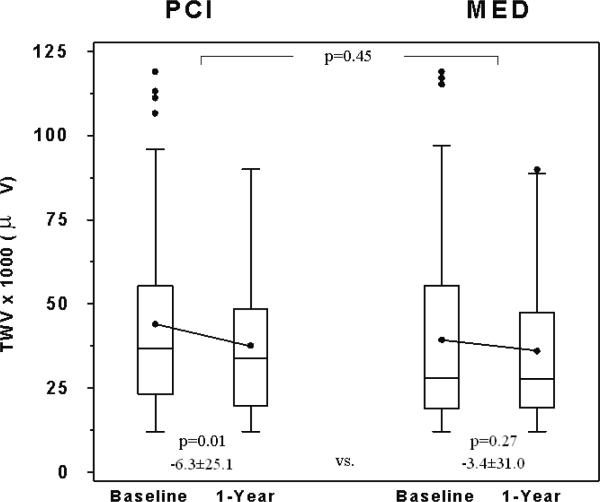
Figure 2.
Comparison of baseline and 1-year A) α1, B) fQRS, and C) TWV between the 2 study groups. Box-and-whisker plots indicate medians (lines), means (dots), and interquartile ranges (box). Probability values indicate baseline to 1-year comparisons within each group and between groups as indicated.


