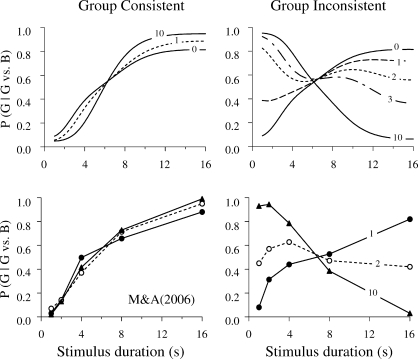
Fig 5.
The top panels show the predictions of LeT for Groups Consistent and Inconsistent. Each curve shows the probability of choosing Green over Blue as a function of sample duration. The number on each curve identifies the session for which the curve applies (e.g., curve 0 = immediately after double bisection training, curve 1 = after one session with the new discrimination training, etc.). The bottom panels show the data from Machado & Arantes (2006). Choices following the 1-s and 16-s samples were reinforced provided they were correct, but choices following the 2-, 4- and 8-s samples were not reinforced. Green was correct following the 16-s samples for Group Consistent and the 1-s samples for Group Inconsistent.

