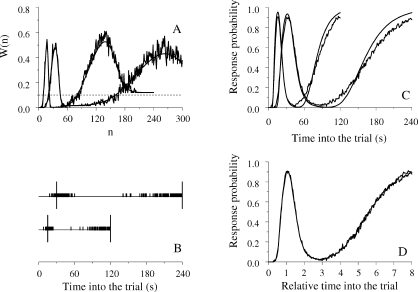
Fig 10.
Model output for two mixed-FI schedules, mixed FI 15s-FI 120s and mixed FI 30s-FI 240s. Panel A: distribution of W(n). The smooth lines plot approximate closed-form solutions derived in the Appendix. Panel B: response distribution for one stat-pigeon during the last trial. Panel C: average response rate. The smooth curves plot the approximations derived in the Appendix. Panel D: the scalar property.

