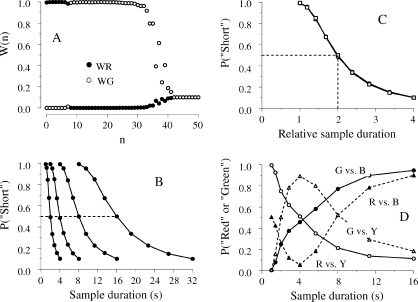
Fig 11.
Model output for the temporal bisection task. Panel A: distribution of the associative links after training with the simple bisection task {S4, S16}→{Red, Green}. The filled and empty circles show the associative links with the Red and Green responses, respectively. Panel B: psychometric functions plotting the probability of choosing “Short” during test trials in four simple bisection tasks. From left to right, the training sample durations were 1 vs. 4, 2 vs. 8, 4 vs. 16, and 8 vs. 32. Panel C: the scalar property with bisection at the geometric mean in the four simple bisection tasks. Panel D: results from the tests with novel key pairings after training on the double bisection task {S1, S4}→{Red, Green} and {S4, S16}→{Blue, Yellow}. Simulation details: training sessions comprised 400 trials with each sample; the generalization sessions comprised 64 trials for each test sample plus 384 trials for each training sample; in the double bisection task, the test sessions with the novel key pairings comprised 64 test trials for each test sample and 3200 trials for each training sample.

