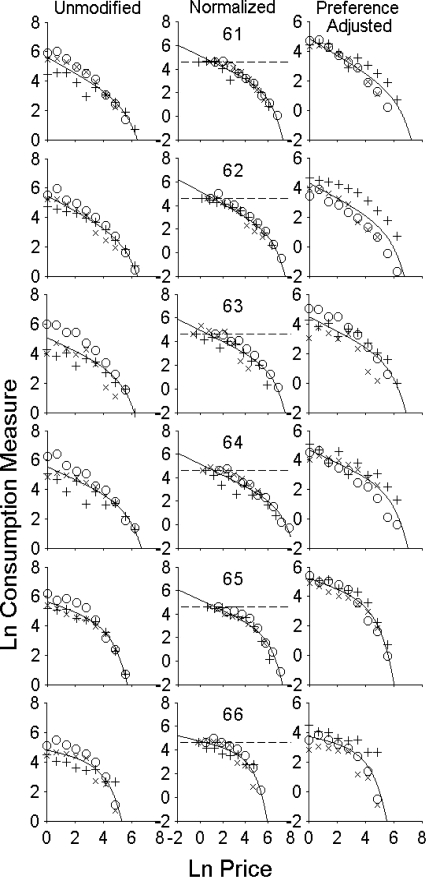
Fig 2.
The left panel shows the natural logarithm of the numbers of reinforcers per session plotted as functions of the natural logarithms of the FR value for each food and for each hen. The data are the averages across the two series of increasing ratios with each food. W data are indicated by plus marks, HPW data by crosses, and PW data by circles. The central panel shows the data after the normalization suggested by Hursh and Winger (1995), where consumption was normalized to a value of 100. The natural logarithm of 100 is indicated by the dashed horizontal line. Price was also modified (see text for details). The right panel shows the data after they were adjusted by the preference values. Here consumption was converted to W equivalents by dividing by the W preferences found in Part 1 of the experiment. The solid lines were fitted to the pooled data in each panel using Equation 1. Their parameter values appear in Table 4. The parameters of functions fitted to the unmodified data and preference adjusted data from each food separately appear in Table 3 and those for the normalized data in Table 5.

