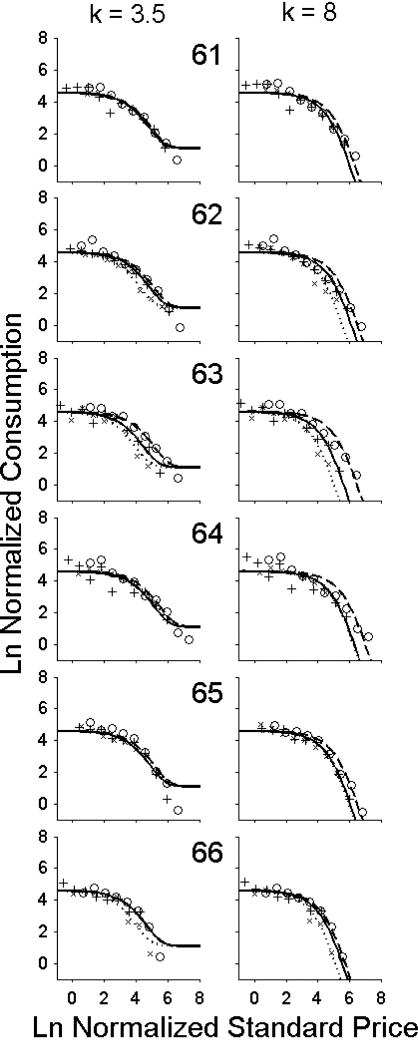
Fig 3.
Both panels show the natural logarithm of the consumption normalized as suggested by Hursh and Silberberg (2008) and plotted as functions of the natural logarithms of the normalized standard price (see text for details) for each food and for each hen. The data are the averages across the two series of increasing ratios with each food. W data are indicated by plus marks, HPW data by crosses, and PW data by circles. The left and right panels show the functions found by fitting Equation 5 with a k value of 3.5 and 8.0, respectively. The solid lines show the functions for the W data, the dotted lines the functions for the HPW data, and the dashed lines the functions for PW data. The parameter values are in Table 6.

