
Figure 1. HIV induces PDL-1 expression on monocytes and CCR5+ T cells.
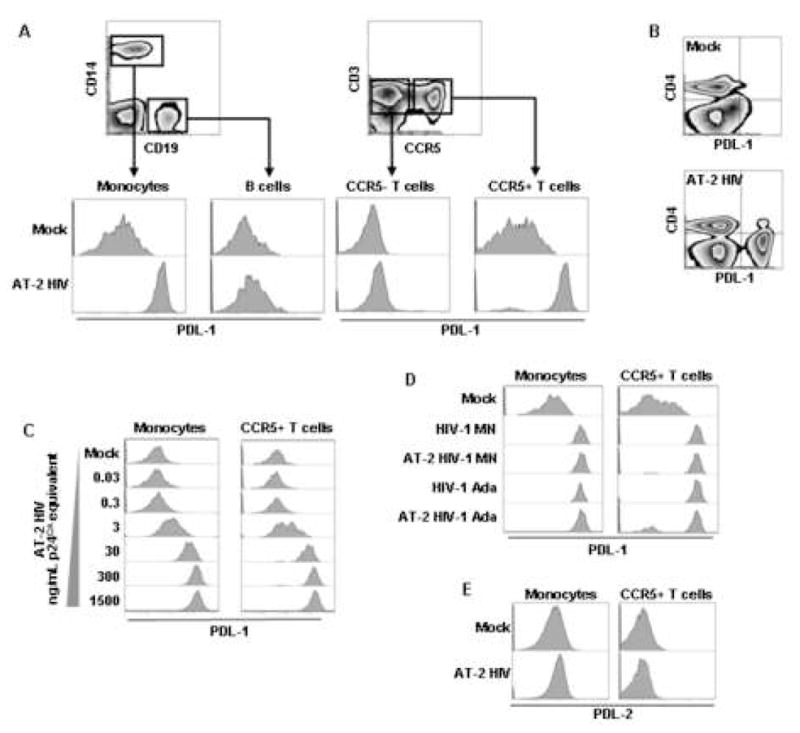
(A) Flow cytometry contour plot showing gating on monocytes (CD14+ cells) and B cells (CD19+) (left upper panel), or CCR5+ and CCR5− T cells (CD3+ cells) (right upper panel); lower panels show flow cytometry histograms of PDL-1 expression in the gated subpopulations after 24 hours of culture of PBMC in presence of AT-2 HIVMN (experiments conducted using AT-2 HIVAda or non-AT-2-treated HIV-1MN or HIV-1Ada gave comparable results) or control microvescicles (Mock). (B) Flow cytometry contour plot showing simultaneous expression of CD4 and PDL-1 in PBMC after 24 hours of culture in presence of AT-2 HIV or control microvescicles (Mock). (C) Flow cytometry histograms of PDL-1 expression gated on monocytes (CD14+ cells) or CCR5+ T cells (CD3+ cells) after 24 hours of culture in presence of different concentrations of AT-2 HIV. (C) Flow cytometry histograms of PDL-1 expression gated on monocytes (CD14+ cells) or CCR5+ T cells (CD3+ cells) after 24 hours of culture in presence of AT-2 HIVMN AT-2 HIVAda or their infectious counterparts. (E) Flow cytometry histograms of PDL-2 expression gated on monocytes (CD14+ cells) or CCR5+ T cells (CD3+ cells) after 24 hours of culture of PBMC in presence of AT-2 HIV or control microvescicles (Mock). In all cases one example characteristic of at least five independent experiments is shown.