
Figure 2. Increased PDL-1 on monocytes and CCR5+ T cells form HIV-infected parients.
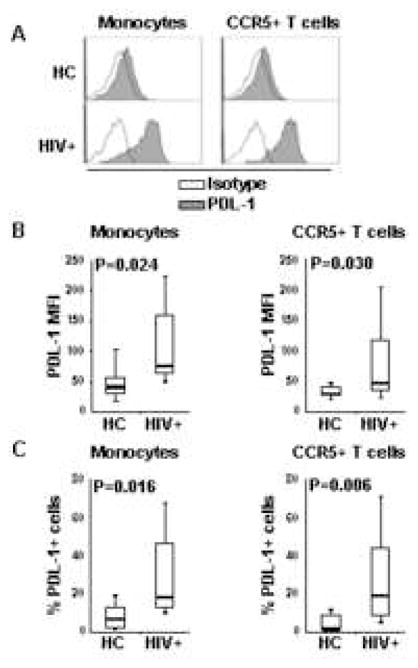
(A) Flow cytometry histograms of PDL-1 expression gated on monocytes (CD14+ cells) or CCR5+ T cells (CD3+ cells) from PBMC of one HIV-uninfected healthy control (HC) and one HIV-infected (HIV+); open lines represent the baseline fluorescence of staining with isotype antibody, solid lines represent fluorescence of staining with anti-PDL-1 antibody. (B) Box plots showing PDL-1 MFI in monocytes and CCR5+ T cells measured in 14 HIV+ and 8 HC. (C) Box plots showing frequency of PDL-1-expressing cells within monocytes and CCR5+ T cells measured in 14 HIV+ and 8 HC. In (B) and (C) horizontal bars represent median values; upper and lower limits of boxes are 75th and 25th percentiles; vertical lines extend to 90th and 10th percentiles.