
Figure 6. IFNAR2 expression is restricted to CCR5-expressing cells.
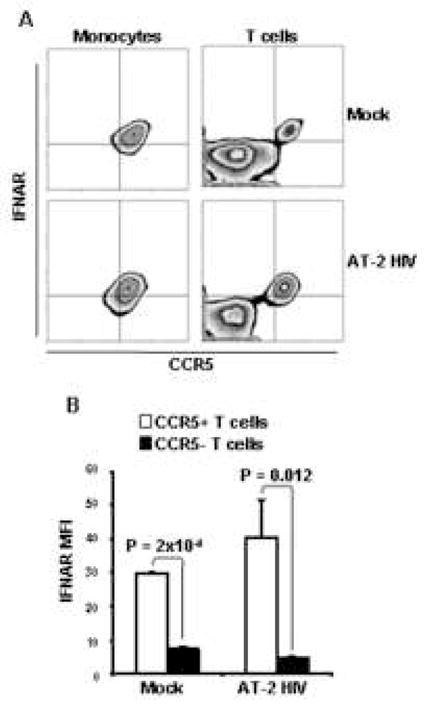
A) Flow cytometry contour plots showing CCR5 and IFNAR2 expression on monocytes (CD14+ cells; left panels) and T cells (CD3+ cells; right panels) from PBMC exposed to mock (upper panels) or AT-2 HIV (lower panels). One example of three independent experiments is shown. B) Bar graphs showing MFI of IFNAR2 staining in CCR5+ CD3+ cells (open bars) and CCR5− CD3+ cells (solid bars) from PBMC exposed to mock or AT-2 HIV. Mean values ± standard error are shown.