
Figure 5.
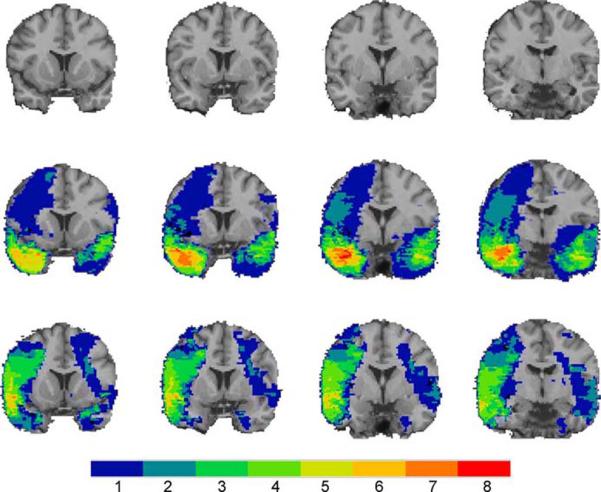
The color indicates the number of veterans with damage to a given voxel. Top row, coronal views of a healthy adult brain. Slices are arranged with the anterior-most slice on the left (y=14; y=8; y=2; y=-4; respectively). Middle row, coronal views of the amygdala group lesion overlap. Bottom row, coronal views of the temporal lobe comparison group lesion overlap. Slices in the middle and bottom rows correspond to the top row. The overlap maps were similar, except for the medial anterior temporal area containing the amygdala, which was damaged in the amygdala group, but intact in the temporal lobe comparison group. From Koenigs and others 2008b.