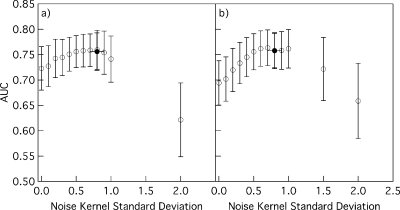
Figure 3.
Average ANN performance measured on the independent validation dataset when the ANNs were trained with noise injection of various noise kernel standard deviation values. Empty circles represent the average AUC values and error bars represent one standard deviation. Filled circles represent the average AUC values of ANNs trained with noise standard deviation values estimated by maximizing Eq. 2, the vertical error bars represent one standard deviation in the AUC values, and the horizontal error bars represent one standard deviation in the selected noise kernel standard deviation values. The ANNs in (a) had 6 hidden nodes and their performance was measured at the 485th training iteration; the ANNs in (b) had 20 hidden nodes and their performance was measured at the 1485th training iteration.

