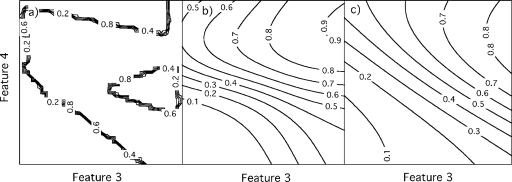
Figure 4.
Contour plots showing classification decision boundaries for (a) ANNs trained without regularization (i.e., overfitting), (b) ANNs trained with noise injection, and (c) ANNs trained with weight decay. The ANNs were trained on a dataset of 50 cases drawn from the breast US dataset, and are shown for fixed values of features 1 and 2.

