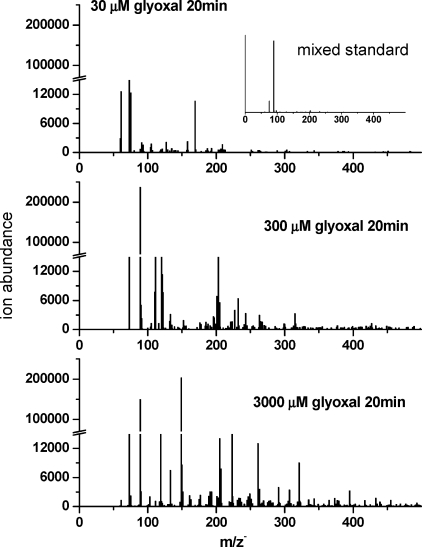
Figure 4.
ESI-MS negative ionization mode spectra of samples taken from glyoxal + OH radical batch reactions (20 min reaction time). From top to bottom: 30 μM glyoxal + OH radical (0.15 mM H2O2 + UV), 300 μM glyoxal + OH radical (1.5 mM H2O2 + UV), and 3000 μM glyoxal + OH radical (15 mM H2O2 + UV). A mass spectrum of mixed standard is shown in the inset (hydrogen peroxide, glyoxal, formic acid, glycolic acid, glyoxylic acid, and oxalic acid each 200 μM, a similar concentration as observed for oxalic acid at 20 min, 3000 μM experiment).

