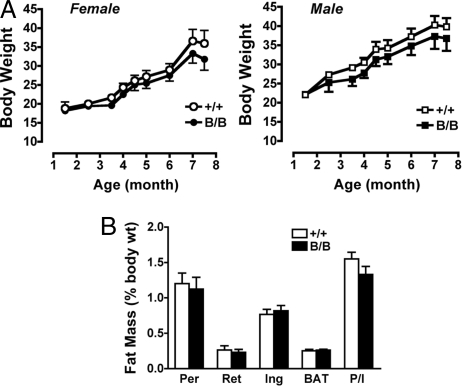
Fig. 2.
Body weights and body fat distribution. (A) Body weight increases in females (Left Panel: Pparg+/+, n = 7; PpargB/B, n = 5) and males (Right Panel: Pparg+/+, n = 10; PpargB/B, n = 7) fed a high-fat diet. No statistical differences were noted at any time point. (B) Adipose tissue mass in 14-week-old male Pparg+/+ (n = 10) and PpargB/B (n = 9) mice fed regular chow, expressed as percentage of body weight. Per, Ret, and Ing represent perigonadal, retroperitoneal, and inguinal WAT, respectively; BAT indicates interscapular brown adipose tissue; P/I indicates the ratio of perigonadal fat weight to inguinal fat weight.

