Fig. 4.
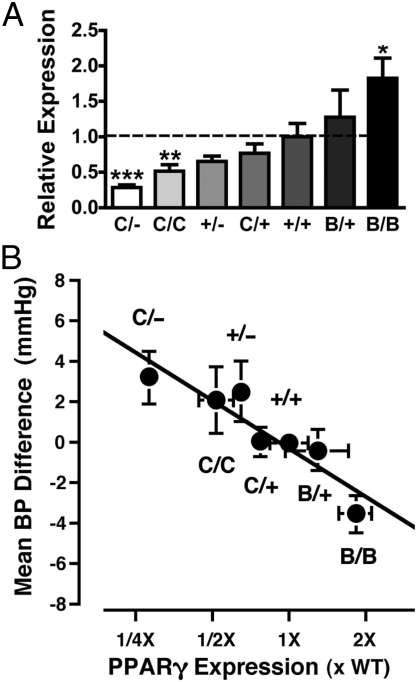
Effects of increased/decreased PPARγ gene expression on blood pressure. (A) Average PPARγ mRNA levels in WATs of PpargC/− (C/−), PpargC/C (C/C), Pparg+/− (+/−), PpargC/+ (C/+), PpargB/+ (B/+), and PpargB/B (B/B) mice relative to their Pparg+/+ littermates (+/+, 100%). *, P < .05; **, P < .01; ***, P < .001 against Pparg+/+ mice. There were 7–9 mice in each group. (B) Mean ± SEM of the blood pressure differences in individual mice from the mean blood pressure of Pparg+/+ littermates within each experiment. n = 49, 40, 38, 115, 285, 51, and 73 for C/−, C/C, +/−, C/+, +/+, B/+ and B/B mice, respectively. The x-axis is the fold change in the average level of PPARγ gene expression in each genotype group from that of their WT littermates determined in (A). The black line indicates a slope of 2.8 mm Hg per 2-fold difference in the expression of PPARγ. The correlation between the mean blood pressure difference for each genotype and the mean expression level for each genotype was r = −0.92 (P < .005; n = 7).

