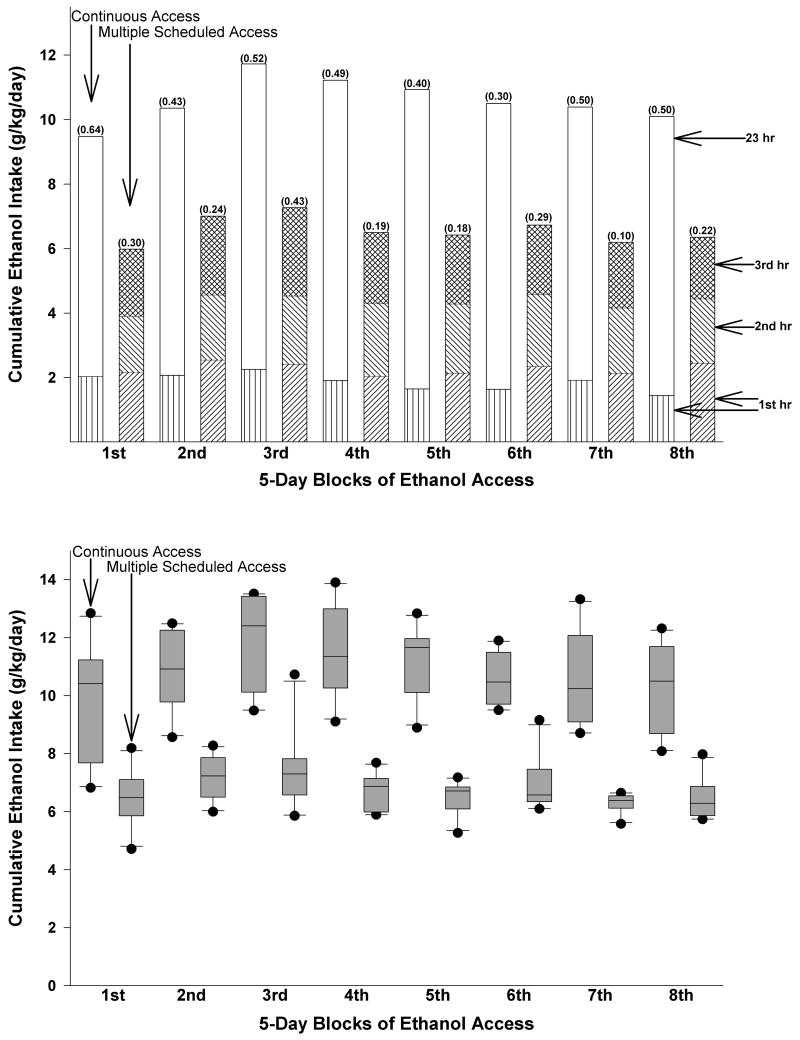
Fig. 1.
The upper panel depicts the 5-day average ethanol intake values (± SEM of the total daily intake indicated in the parentheses) for the first and subsequent 23 hours of the continuous access (CA) P rats and the 5-day average ethanol intake values for the three 1-hour access periods of the multiple scheduled access (MSA) P rats. The box plot in the lower panel indicates that the distributions (CA versus MSA) of drinking scores, for the most part, did not overlap, which includes the most extreme scores. Note: the 5-day averages represent the days that ethanol (15% and 30% concurrent with water) was available to both CA and MSA P rats.

