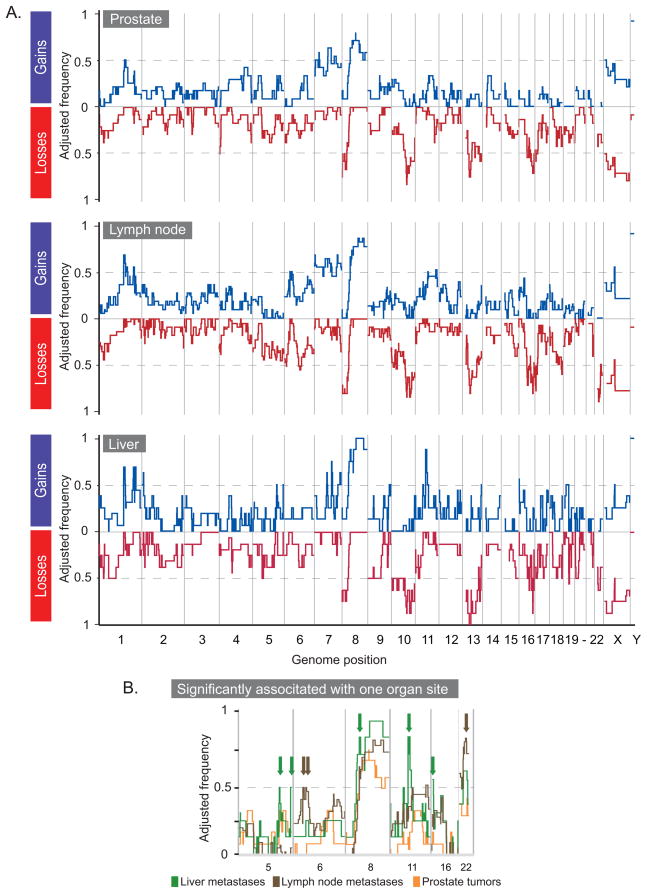
Figure 3.
Deviations in CR tumors stratified by organ of origin. (A) The adjusted frequencies of deviation (y-axis) for gain (blue) or loss (red) for prostate tumors (n=15), lymph-node (n=19), and liver (n=9) metastasis, respectively. (B) Zoom in for gains on chromosomes 5, 6, 8, 11, and 16 and losses on chromosome 22. Alterations significantly associated with lymph node (brown) and liver (green) metastases are indicated by arrows.

