
Figure 1.
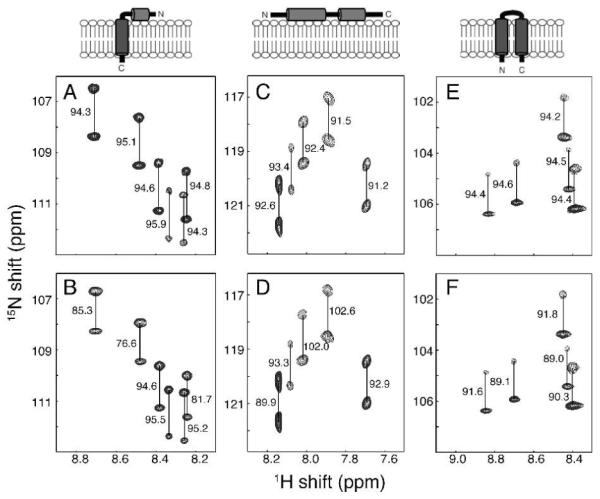
Representative regions of 1H-15N IPAP-HSQC spectra of isotropic (A, C and E) and aligned (B, D and F) samples. (A and B) Uniformly 15N labeled membrane-bound form of Pf1 coat protein10 in 100 mM DHPC, pH 6.7. (C and D) 15N-Ile labeled cytoplasmic domain of Vpu11 in 100 mM DHPC, 20 mM HEPES, pH 6.5. (E and F) Uniformly 15N-labeled MerFt12 in 100 mM DHPC, pH 6.5. The alignment resulted from the inclusion of 28 mg/ml, 13 mg/ml, and 30 mg/ml of fd bacteriophage in samples B, D, and F, respectively. The samples were maintained at 50°C for the measurements performed on a cryoprobe-equipped Bruker 600 MHz spectrometer. The measured values of the one-bond 1H-15N splittings are in Hz.