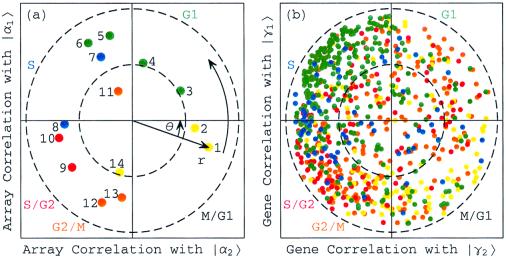
Figure 2.
Normalized elutriation expression in the subspace associated with the cell cycle. (a) Array correlation with |α1〉N along the y-axis vs. that with |α2〉N along the x-axis, color-coded according to the classification of the arrays into the five cell cycle stages, M/G1 (yellow), G1 (green), S (blue), S/G2 (red), and G2/M (orange). The dashed unit and half-unit circles outline 100% and 25% of overall normalized array expression in the |α1〉N and |α2〉N subspace. (b) Correlation of each gene with |γ1〉N vs. that with |γ2〉N, for 784 cell cycle regulated genes, color-coded according to the classification by Spellman et al. (3).

