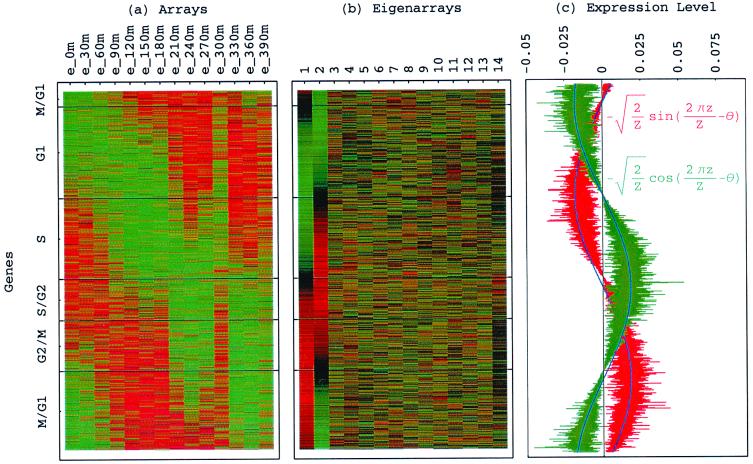
Figure 3.
Genes sorted by relative correlation with |γ1〉N and |γ2〉N of normalized elutriation. (a) Normalized elutriation expression of the sorted 5,981 genes in the 14 arrays, showing traveling wave of expression. (b) Eigenarrays expression; the expression of |α1〉N and |α2〉N, the eigenarrays corresponding to |γ1〉N and |γ2〉N, displays the sorting. (c) Expression levels of |α1〉N (red) and |α2〉N (green) fit normalized sine and cosine functions of period Z ≡ N − 1 = 5,980 and phase θ ≈ 2π/13 (blue), respectively.

