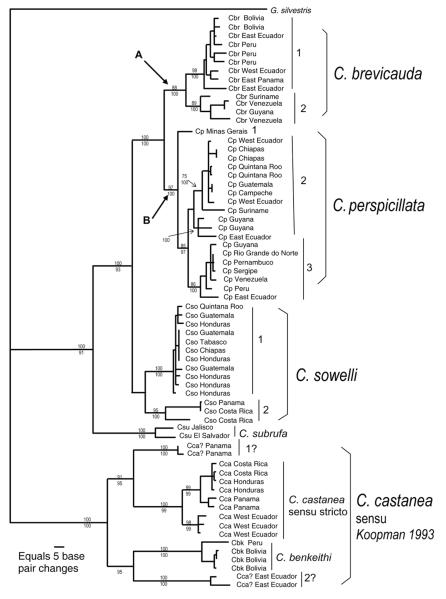
Fig. 1.
Phylogram of genetic relationships among species of the bat genus Carollia based on complete DNA sequences from the mitochondrial cytochrome-b gene. This maximum-likelihood tree depicts phylogroups and genetic distance (horizontal length of each clade) pertinent to illustrating the application of the Genetic Species Concept. This figure was developed from data and figure 3 of Hoffman and Baker (2003). Information from a parsimony analysis (significant bootstrap values ≥ 70 above a clade) and a Bayesian analysis (significant posterior probability values ≥ 95 below a clade) were superimposed on the tree to illustrate support values for nodes and clades. Values not provided were not statistically significant. Combined distance values of A (shared common ancestry of all specimens of C. brevicauda) and B (shared common ancestry of C. perspicillata) represent the “duration of speciation” value of Avise and Walker (1998). Abbreviation for each specimen: Cbr = C. brevicauda, Cp = C. perspicillata, Cso = C. sowelli, Csu = C. subrufa, Cca = C. castanea, and Cbk = C. benkeithi. Numbers by vertical lines within species identify intraspecific phylogroups referred to in the text. Glyphonycteris sylvestris was used as the outgroup.

