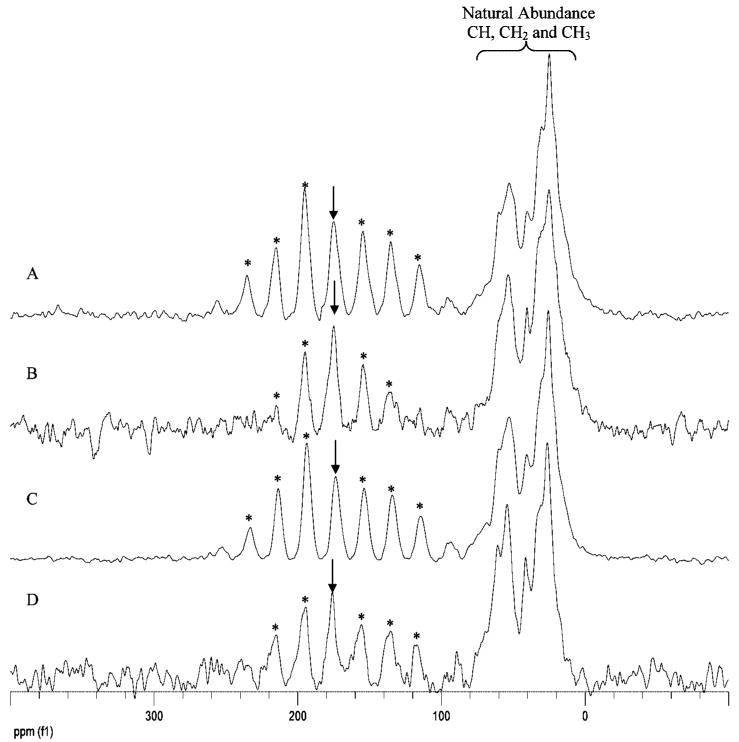
Figure 2.

Spectra from top to bottom: (A) LRAP-K54(13C′) hydrated frozen, (B) LRAP-K54(13C′) hydrated room temperature, (C) LRAP-V58(13C′) hydrated frozen, and (D) LRAP-V58(13C′) hydrated room temperature. The arrow indicates the backbone carbonyl isotropic resonance, and the asterisks indicate the spinning side bands. The loss in CP intensity (evidenced by the decrease in signal-to-noise) and the change in the spinning sideband pattern for LRAP-K54(13C′) and LRAP-V58(13C′) in the presence of water all indicate mobility on the NMR time scale (10−3–10−5 sec).
