
Figure 7.
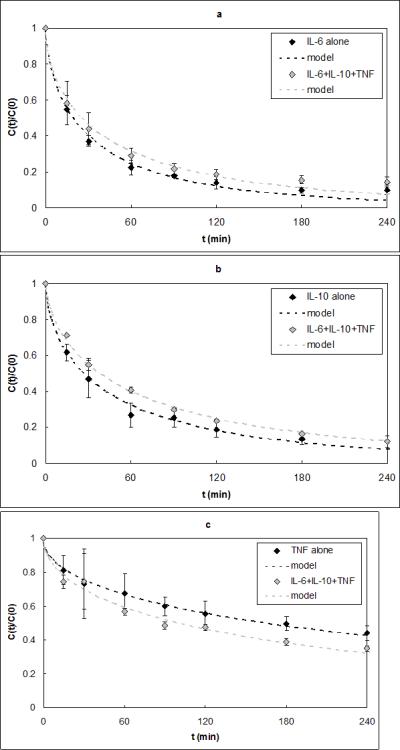
a) IL-6 capture data alone and in a three-cytokine solution. The model ΓIL-6 fits were 1.05e-4 and 6.22e-5 cm2·ml·min−1·g−1 and were not statistically different (p=0.99). b) IL-10 capture data alone and in a three-cytokine solution. The model ΓIL-10 fits were 6.66e-5 and 3.69e-5 cm2·ml·min−1·g−1 and were not statistically different (p=0.15). c) TNF capture data alone and in a three-cytokine solution. The model ΓTNF fits were 5.85e-6 and 9.05e-6 cm2·ml·min−1·g−1 and were not statistically different (p=0.99).