
Fig. 4.
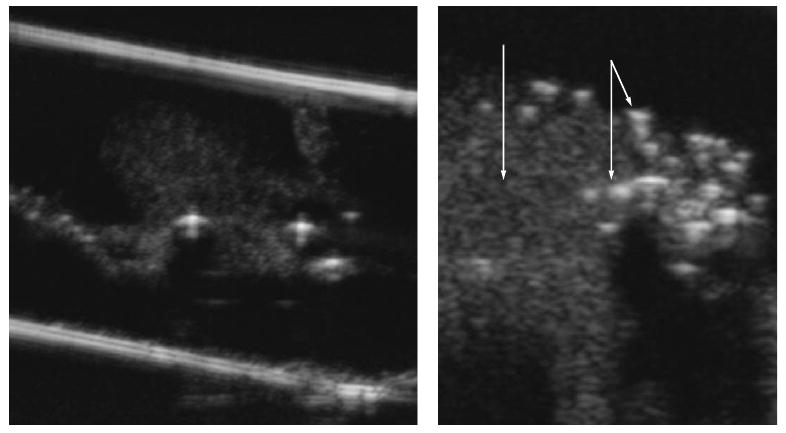
Ultrasound imaging of droplets (darker spots) and bubbles (brighter spots) upon the injection of nanodroplets (1 vol % PFP/0.25% PEG-PLLA) into the agarose gel (on the left). The enlarged part of the image is given on the right for the illustration of differences in the echogenicity of the droplets and bubbles; the single arrow indicates the accumulation of droplets; the double arrow, bubbles.