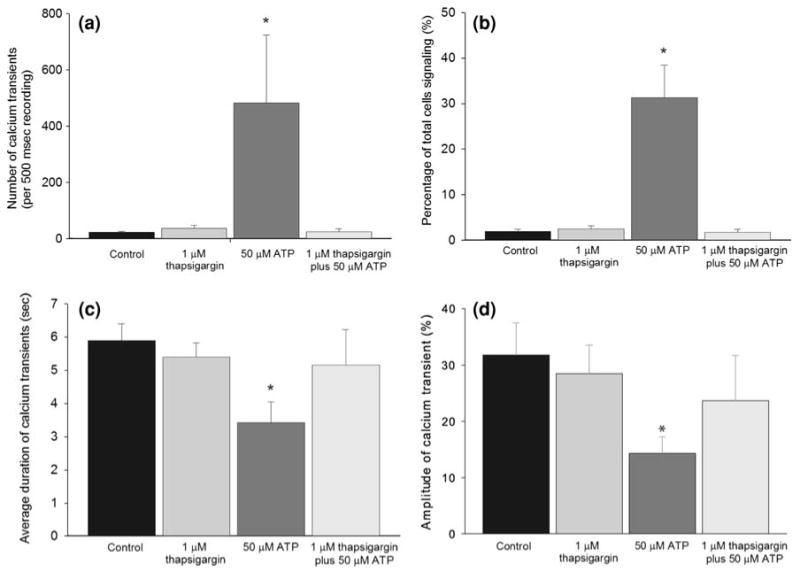
FIGURE 2.

Intracellular calcium transients in untreated rMC-1 vs. cells treated with 50 μM ATP, 1 μM Thapsigargin, and 50 μM ATP with 1 μM Thapsigargin. Two-tailed Student t-tests were used to test for statistical significance. (a) The total number of calcium transients recorded during 500-s movies. (b) Percentage of cells that exhibited intracellular calcium transients during 500-s movies. (c) The average duration of calcium transients. (d) The average amplitude change of calcium transients calculated as ΔF/F. *p<0.01, **p<0.001, n = 7.
