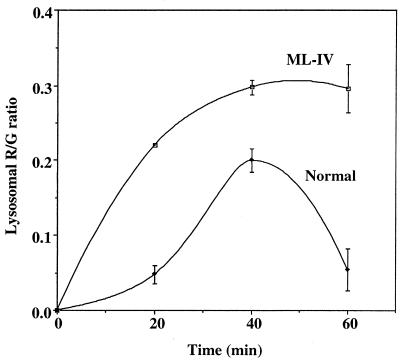
Figure 5.
Temporal changes in accumulation of C5-DMB-LacCer at the lysosomes. Normal and ML-IV cells were incubated with blue dextran and C5-DMB-LacCer/defatted BSA as in Fig. 4. Images were acquired at each time point and the R/G ratio of individual lysosomes was quantified. Attempts to quantify the R/G ratio at earlier time points were not reliable because there was often substantial overlap of lysosomes and endosomes in the same region of the cell at these times, making it difficult to generate an appropriate “lysosome mask” for these calculations.

