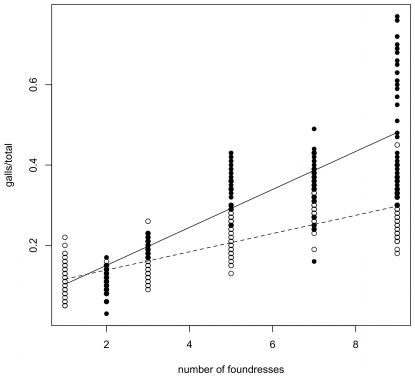
Figure 5. Galling data under consecutive (○) and staggered (•) introduction experiments.
As more live foundresses co-occur in the syconium, galling rates are depressed. This confirms the theoretical result from our oviposition model and is consistent with interference among foundresses. Fitted lines are linear regressions (dashed = consecutive, solid = staggered).

