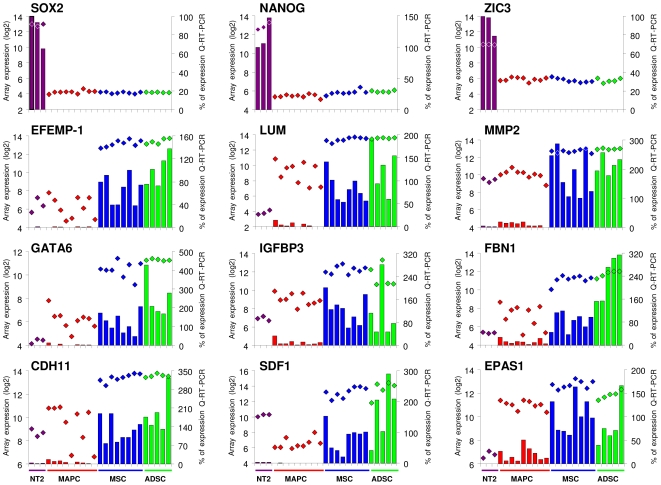
Figure 2. Expression of genes from the consensus ESC and differentiation genes lists in NTERA-2, MAPC, MSC and ADSC cells by Q-RT-PCR.
Gene expression was measured using the relative standard curve method. GAPDH was used as a housekeeping control. Expression values of each sample from Affymetrix arrays (logarithmic scale: rhombuses) and from Q-RT-PCR analysis (percentages: bars) are shown for each gene. Q-RT-PCR results are expressed on the secondary vertical axis as a % of expression relative to NTERA-2 for consensus ESC genes, and to MSC for consensus differentiation genes. Each bar represents the value of a different cell line.

