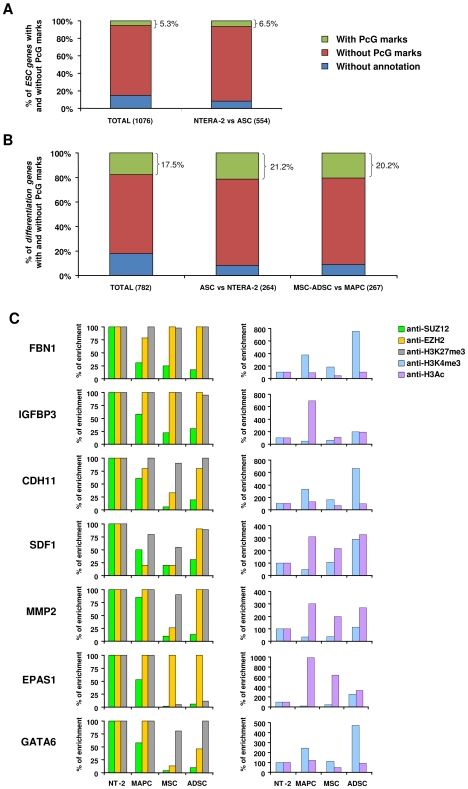
Figure 3. Consensus ESC and differentiation genes with predicted Polycomb group marks, and regulation of differentiation genes by PcG proteins in stem cells.
A, Bar graph displaying the percentage of genes targeted by PcG marks among the consensus ESC gene list and among the ESC genes upregulated in NTERA-2 cells relative to ASC. B, Bar graph displaying the percentage of genes targeted by PcG marks among the consensus differentiation gene list, the differentiation genes upregulated in ASC relative to NTERA-2 cells, and differentiation genes upregulated in MSC and ADSC versus MAPC. The numbers in brackets represent the total number of genes. C, Occupancy of EZH2, SUZ12, H3K27m3, H3K4me3 and H3 acetylated, assessed by Q-ChIP-PCR, in the promoters of differentiation genes. Enrichment is presented as a percentage relative to NTERA-2 (100%).

