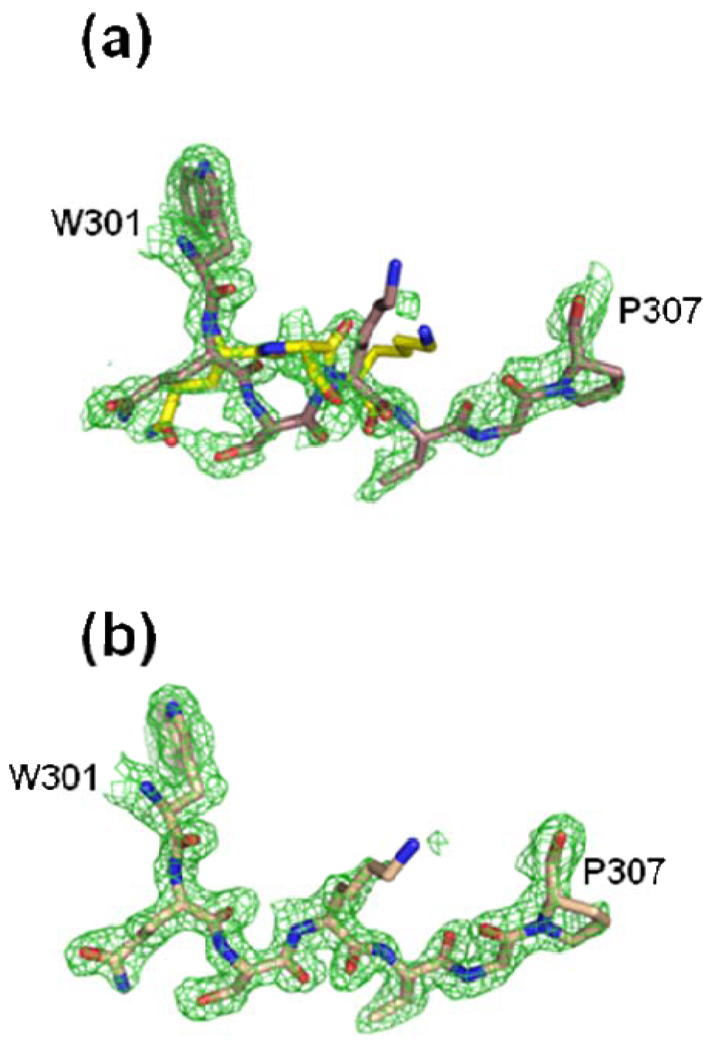
Figure 2.
Alternate conformations observed in the conserved loop region of human ferrochelatase consisting of residues 301–307 for monomer A (Panel a). The electron density for the same residues in monomer B (Panel b) was much cleaner and indicated a single conformation. In both panels the green cage represents a 2Fo-Fc composite omit map that was generated using the simulated annealing protocol with 7% of the model omitted per cycle and contoured at one sigma. Atom coloring is the same as that shown in Figure 1 except that the carbon atoms are colored yellow for the alternate conformations of residues 302, 303, and 304.

