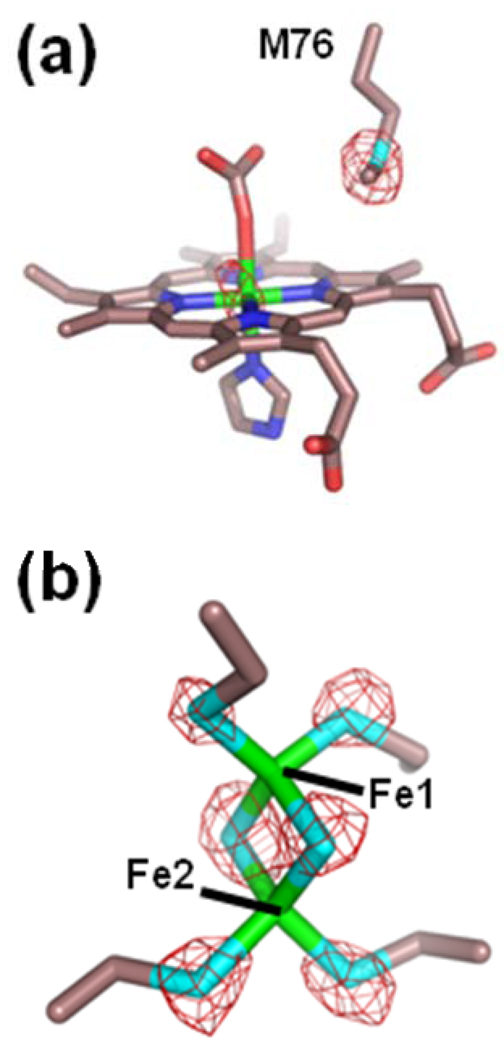
Figure 3.
Model and anomalous data for the HG-PROTO crystals (Table 1) of wild-type human ferrochelatase for subunit A. The electron density (red cage) represents anomalous signal for data collected at a wavelength of 1.9 Å and is contoured at 6 σ. The model is represented in stick format with carbon, oxygen, nitrogen, sulfur, and iron colored yellow, red, blue, cyan, and green, respectively.

