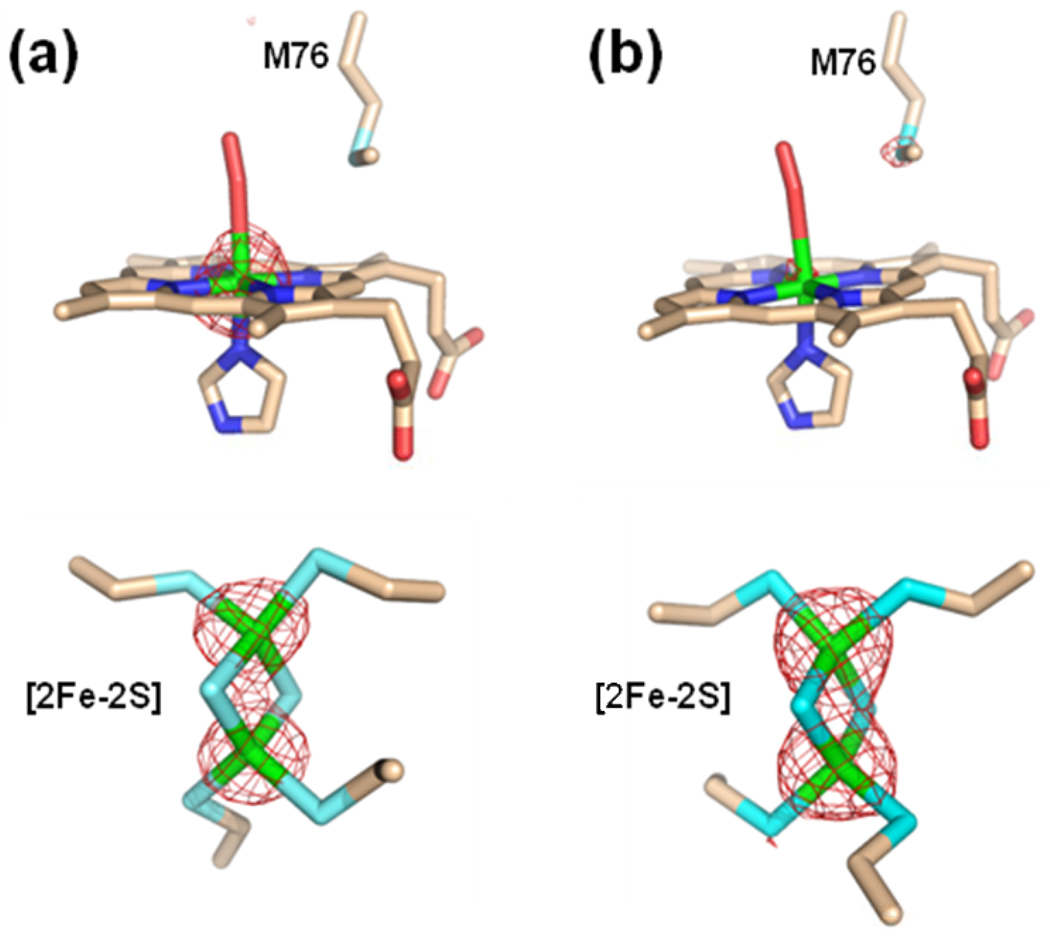
Figure 7.
Model and anomalous signal for the NI-DEUT crystals for data collected at an X-ray energy of 1.45 Å(Panel a) and 1.70 Å (Panel b). For both panels the upper image shows the model and anomalous signal around the metallated deuteroporphyrin and the lower panel show the model and anomalous signal around the [2Fe-2S] cluster. In both cases the anomalous map is contoured at 8 σ and represented by the red cage. The model is shown in stick format and carbon, nitrogen, oxygen, sulfur, and iron are colored tan, blue, red, cyan, and green respectively.

