Figure 2.

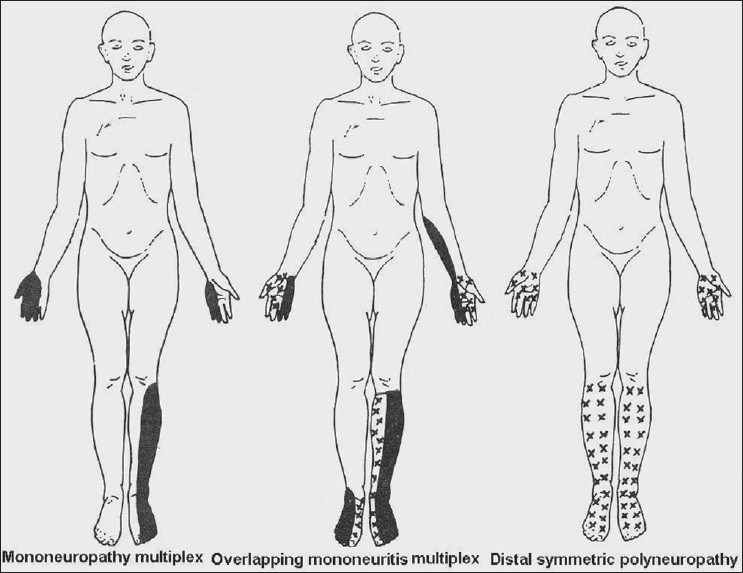
Schematic diagram shows topography of deficit inmononeuropathy multiplex, overlap neuropathy and distal symmetrical polyneuropathy

Schematic diagram shows topography of deficit inmononeuropathy multiplex, overlap neuropathy and distal symmetrical polyneuropathy