Figure 3.

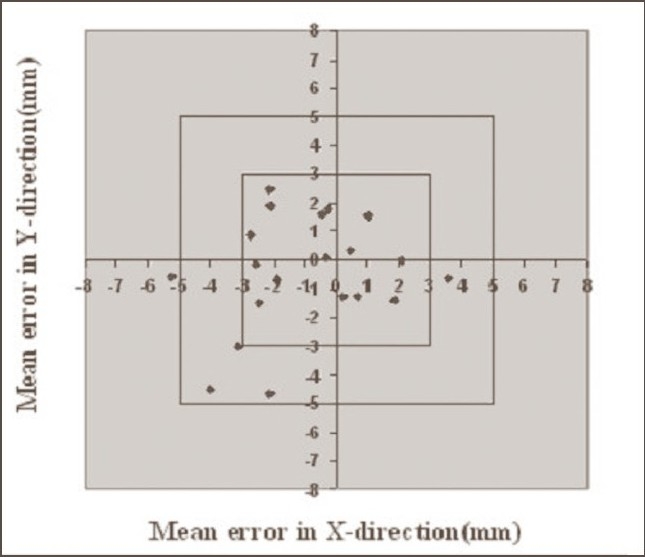
Systematic errors in pelvis cases without Orfit. Graph shows the number of average mean deviations <3 mm, between 3 and 5 mm, and >5 mm in X and Y directions

Systematic errors in pelvis cases without Orfit. Graph shows the number of average mean deviations <3 mm, between 3 and 5 mm, and >5 mm in X and Y directions