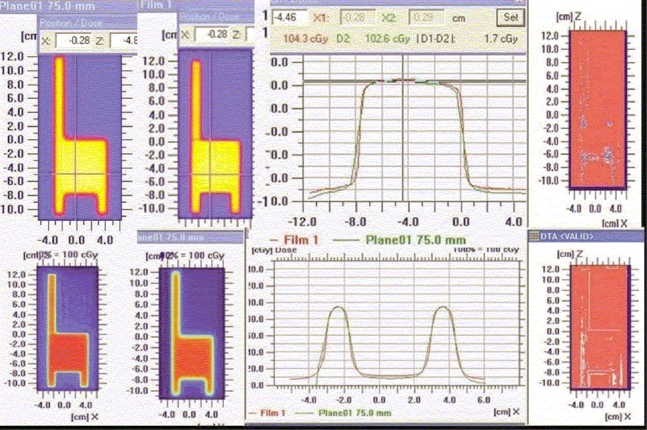
Figure 7.

‘h’-shaped density pattern (top left — film; top middle — TPS) Superimposed dose profile — parallel to the direction of leaf movement, in the uniform dose region of chair (top right); superimposed dose profile — parallel to the direction of leaf movement, in the leg region of chair (bottom left); and quantitative evaluation of superimposed dose profile with Gamma
