Figure 10.

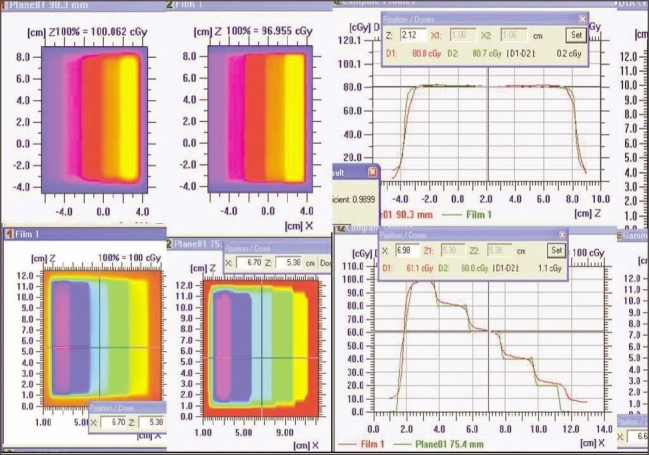
Varying density pattern of X wedge (left top and bottom) and superimposed dose profile parallel to the direction of leaf movement (top right) and quantitative evaluation of superimposed dose profile with DTA (distance to agreement)

Varying density pattern of X wedge (left top and bottom) and superimposed dose profile parallel to the direction of leaf movement (top right) and quantitative evaluation of superimposed dose profile with DTA (distance to agreement)