Figure 2.

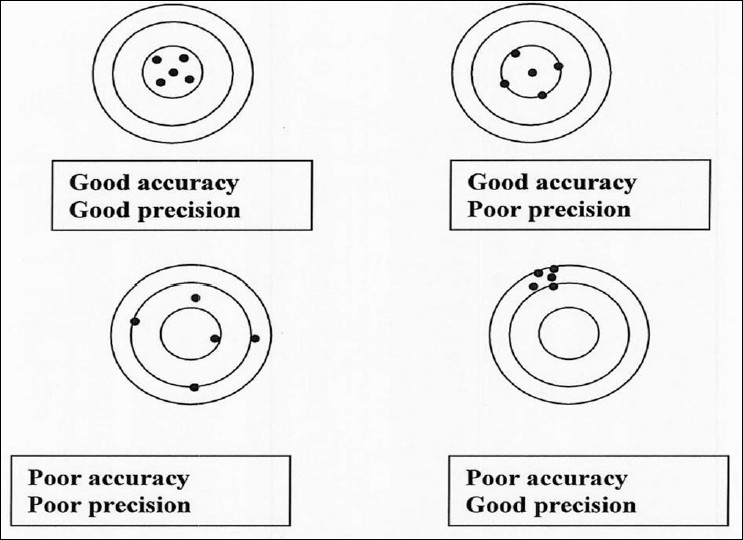
Illustration of the difference in precision and accuracy. The center of the circle represents the true value and the black dots represent the measured values (edited from Njeh and Langton with permission)

Illustration of the difference in precision and accuracy. The center of the circle represents the true value and the black dots represent the measured values (edited from Njeh and Langton with permission)