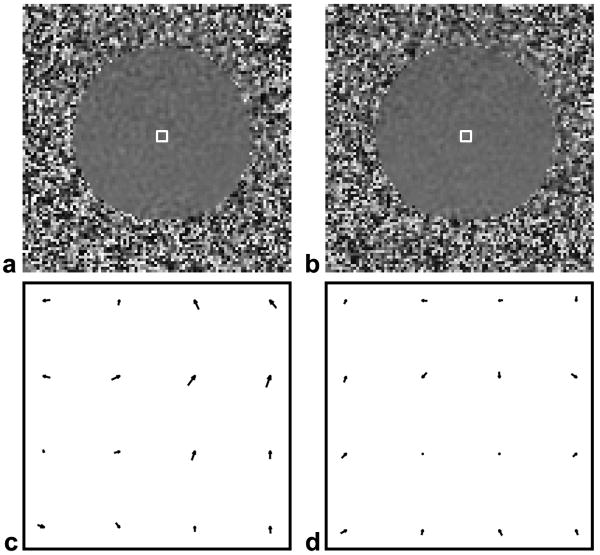
Fig. 2.
Example DENSE phase images and displacement maps of the stationary phantom for both simple (a, c) and balanced (b, d) three-point displacement-encoding strategies. The top row (a, b): phase images representing displacement in the y direction. The bottom row (c, d): the pixel-by-pixel 2D displacement maps of the area marked by the square boxes shown in (a) and (b).

