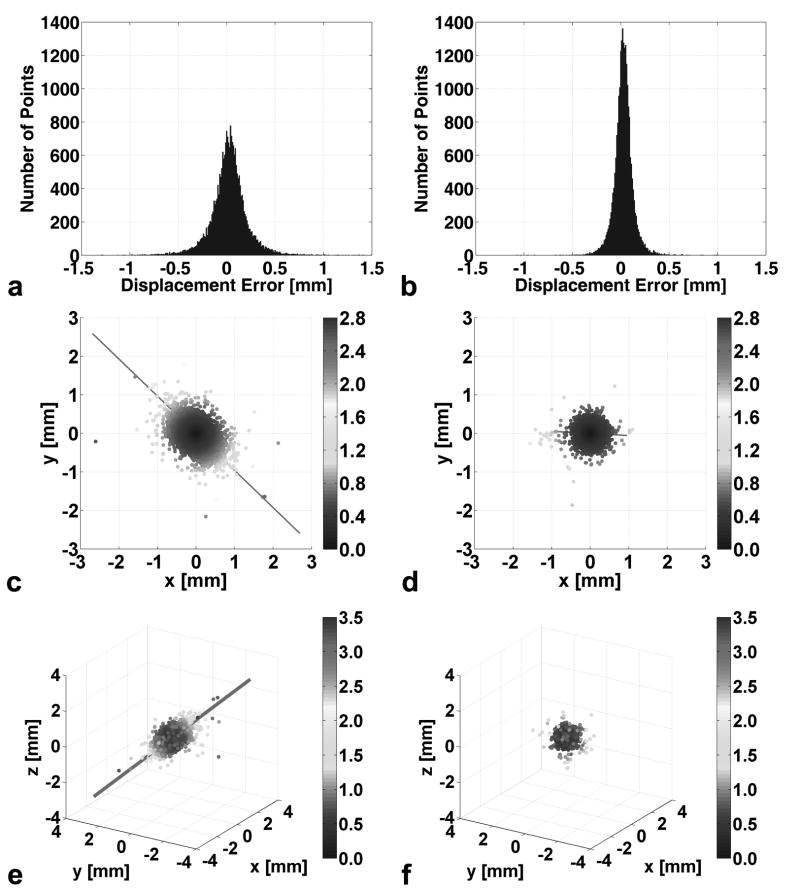
Fig. 3.
Measured displacement error plots for simple (a, c, e) and balanced (b, d, f) multi-point displacement encoding from a stationary water phantom. Displacement error histograms for the simple (a) and balanced (b) two-point encoding methods. Two-dimensional displacement error scatter plots for the simple (c) and balanced (d) three-point encoding methods. Three-dimensional displacement error scatter plots for the simple (e) and balanced (f) four-point encoding methods. The gray level of the points in (c-f) represents the magnitude of the displacement error vector. The unit is in mm. The straight lines in (c-f) indicate the principal eigenvectors of the dyadic tensors, whose lengths correspond to the eigenvalues scaled by a factor of 1/350 for improved visualization. The eigenvectors quantify the direction bias of the encoding strategies.

