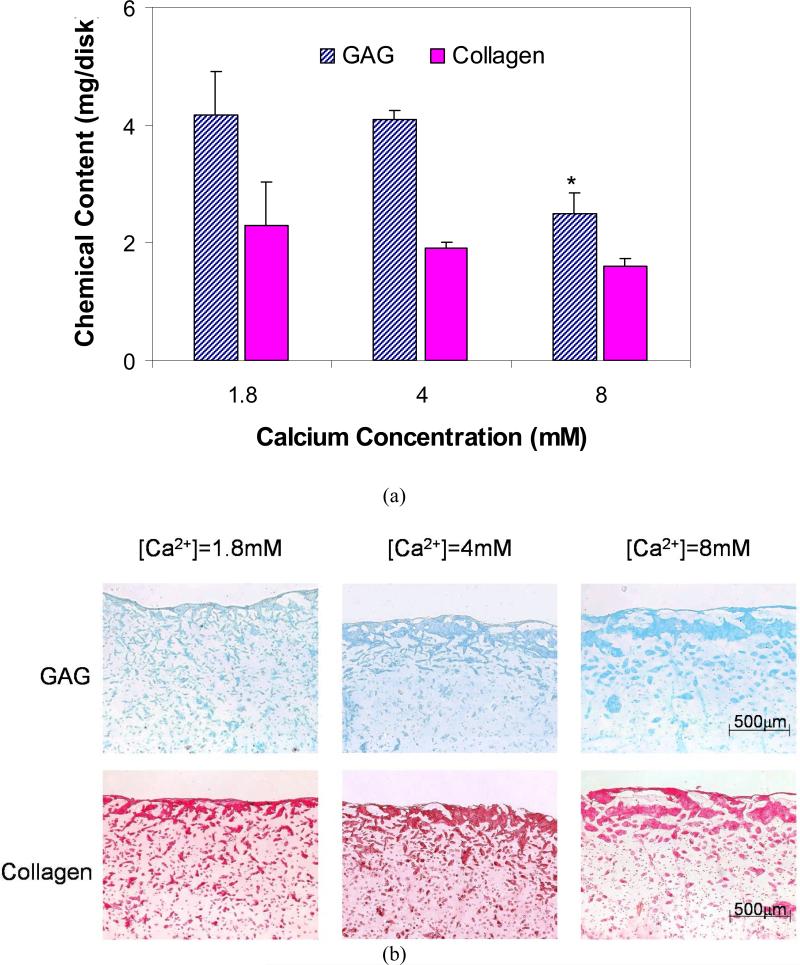
Figure 5.
Effects of calcium concentration (a) on glycosaminoglycan (GAG) and collagen contents inside chondrocyte-embedded alginate hydrogel constructs after incubation for 28 days. (n=4; * Significant differences relative to [Ca2+] = 1.8mM and 4.0mM; p<0.05, SNK) and (b) on the distribution of GAG and collagen inside constructs (Top: Alcian Blue staining; Bottom: Picosirius Red staining).

