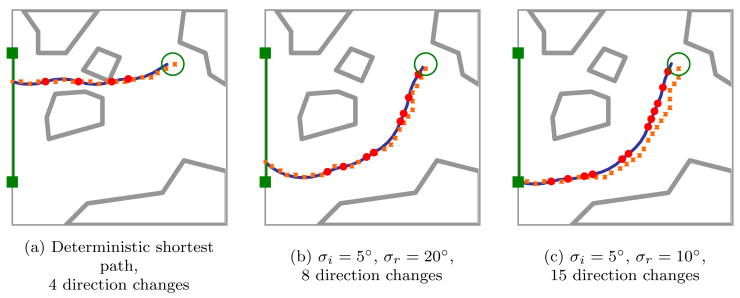
Figure 8.
The small squares depict the discrete states used internally by the motion planning algorithm when predicting the expected path from the start state, while the solid line shows the actual expected needle path based on constant-curvature motion. The cumulative error due to discretization, which is bounded as described in Sec. 3.3, is generally smaller when fewer direction changes (indicated by solid circles) are performed.

