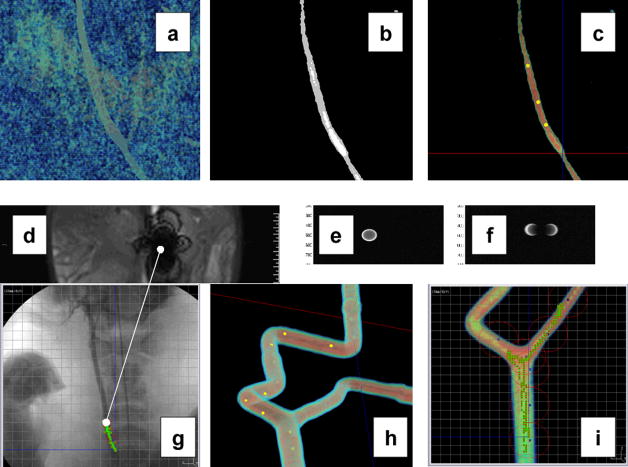
Fig. 5.
Some MR-imaging techniques used for the experiments; (a) and (b) unfiltered and filtered MR-image of the carotid artery of the living animal; (c) the same artery with waypoints being plotted to provide trajectory control commands to the computer; (d) distorted MR-image created by the 1.5mm chrome steel sphere (see media extension 1); (e) and (f) MR-image of the ferromagnetic sphere using the MS-SET method as seen in the transversal and sagittal plane respectively; (g) the same ferromagnetic sphere being tracked using the MS-SET method over a pre-acquired x-ray image (optional) providing additional physiological information (e.g. the spinal cord) while being controlled at 24 Hz in the carotid artery of the living swine along the waypoints (the line joining Fig. 5d shows the difference when using the MS-SET method compared to a distorted image); (h) shows the waypoints plotted over the MR-image of a phantom mimicking human vascular conditions and being showed through a dedicated imaging software with (i) the respective real-time displacement of the sphere being displayed.

