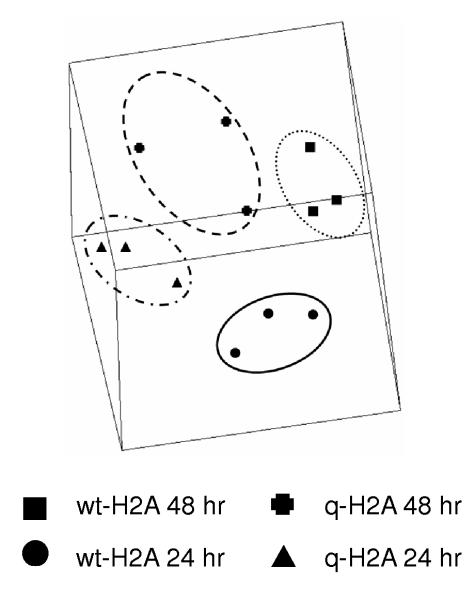
Fig. 3.
A three-dimensional screen capture of the Multi-Dimensional Scaling analysis of the microarray results showing the formation of individual clusters with no overlap in global gene expression by cells expressing the wild type (wt-H2A) and truncated (q-H2A) histones at 24 and 48 hr post-induction.

