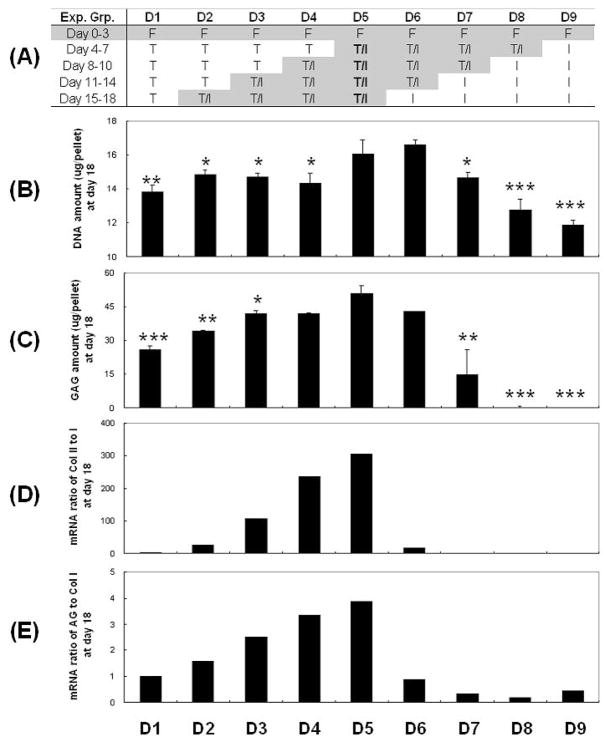
Figure 5. Effects of differentiation growth factor cocktails: biochemical data.
(A) Experimental groups. (B): DNA contents (μg/pellet). (C): GAG contents (μg/pellet). (D): mRNA ratio of collagen II to collagen I. (E): mRNA ratio of aggrecan to collagen I. Data are shown as Ave ± SD (n = 4) after 18 days of culture. Statistically significant differences compared to D5 are shown with * for p<0.05, ** for p<0.01, and *** for p<0.001.

