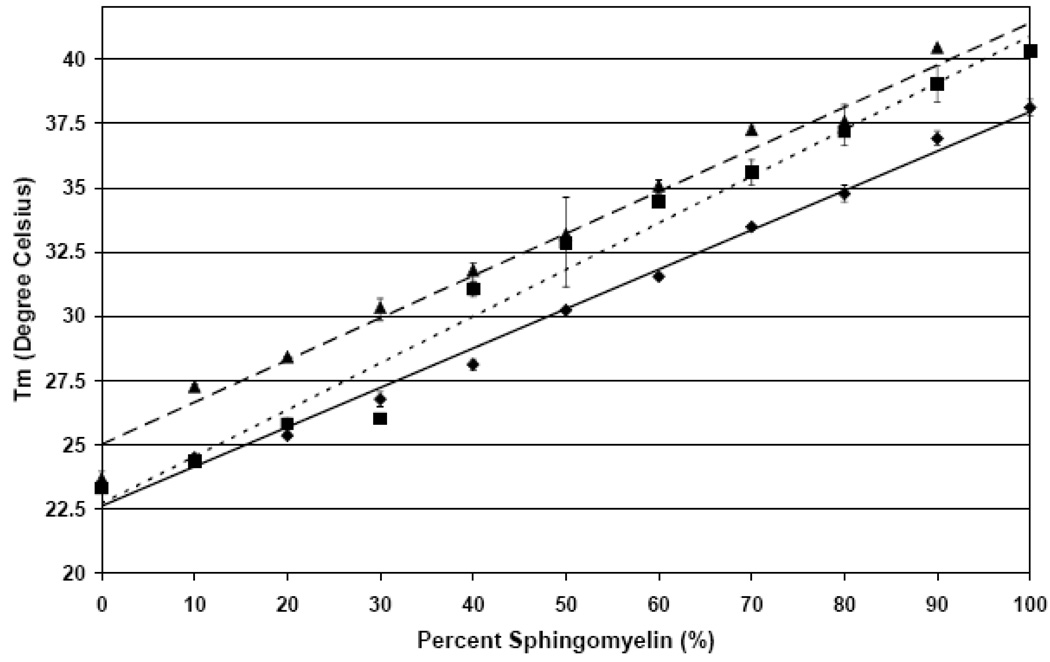
Figure 2.
The average melting temperature (Tm) of DMPC and SM liposomes of the Lα transition with and without apoLp-III measured. Shown are data points at 10% SM increments (± SE) and the corresponding trend line. (♦,——)) Average Tm liposomes; (▪,- - - - -)) average Tm for liposomes and apoLp-III; (▲, — — —) average Tm for liposomes and codissolved apoLp-III.

