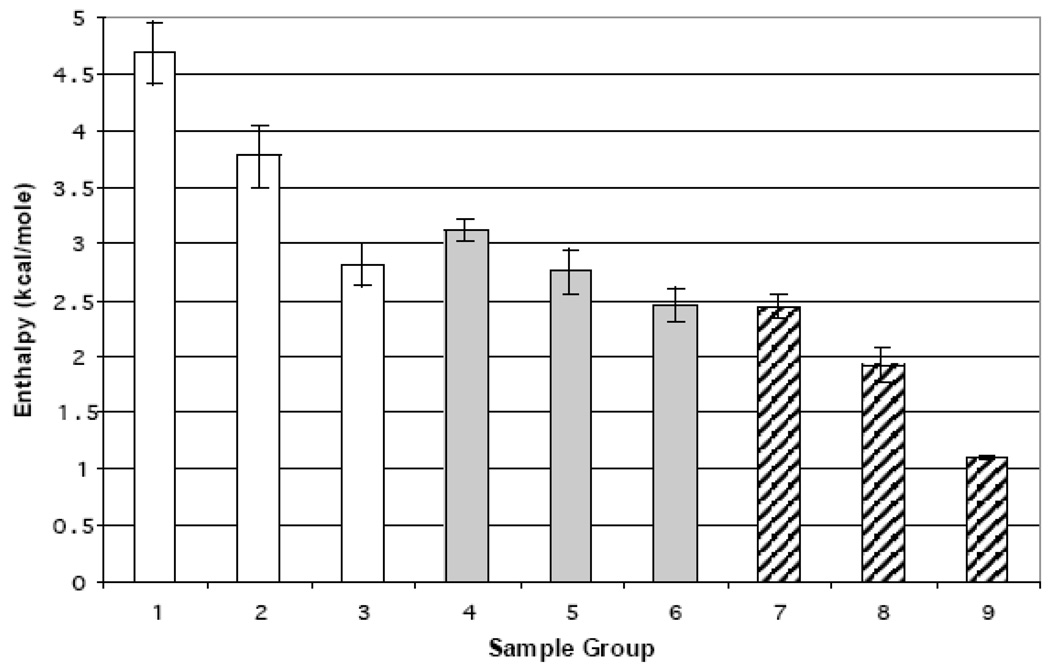
Figure 4.
Average enthalpy of the Lα transition of the DMPC/SM liposomes. (□)liposomes; ( ) liposomes and apoLp-III; (
 ) liposomes and codissolved apoLp-III. Group 1: 0, 20, 60, 80, 90, 100 %SM Group 2: 10, 40, 70 %SM Group 3 30, 50 %SM Group 4: 10, 20, 30, 80%SM Group 5: 40, 70 %SM Group 6: 0, 50, 60 90 100 %SM Group 7: 0, 20, 30, 40, 60, 80 % SM Group 8: 10, 50, 70, 100 %SM Group 9: 90% SM. Group 9 error bars represent the range between the maximum and minimum values.

