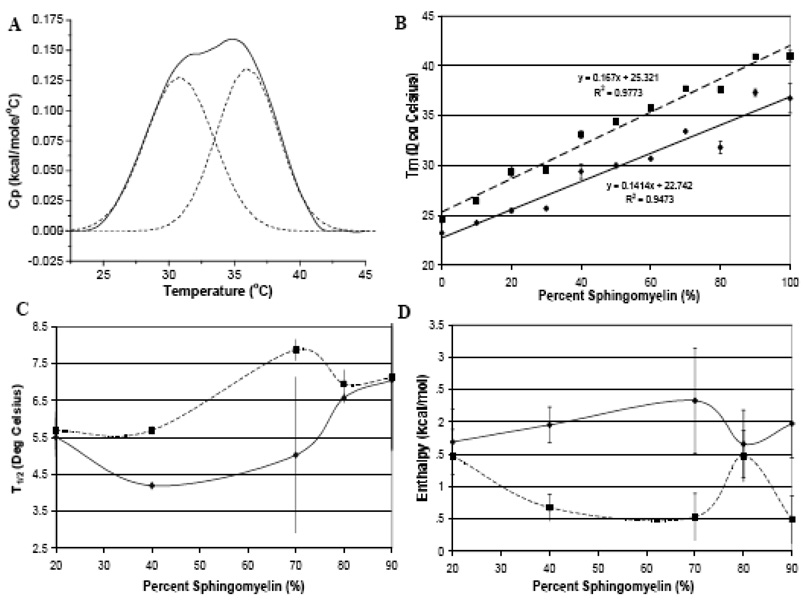
Figure 6.
2 Peak Gaussian Fittings for DMPC SM liposomes with apoLp-III (molar ratio 30:1). A) Curve Fitting of DSC heating scan of 20% DMPC and 80% SM with apoLp-III. B) 2 Peak Gaussian Fittings for Tm C) 2 Peak Gaussian Fittings for T1/2 D) 2 Peak Gaussian Fittings for Enthalpy (▪) Peak 1 DMPC (♦) Peak 2 (SM) (——) Trend line for Peak 1 (---) Trend Line for Peak 2. All Values are shown are averages with the error bars representing the maximum and minimum values.

