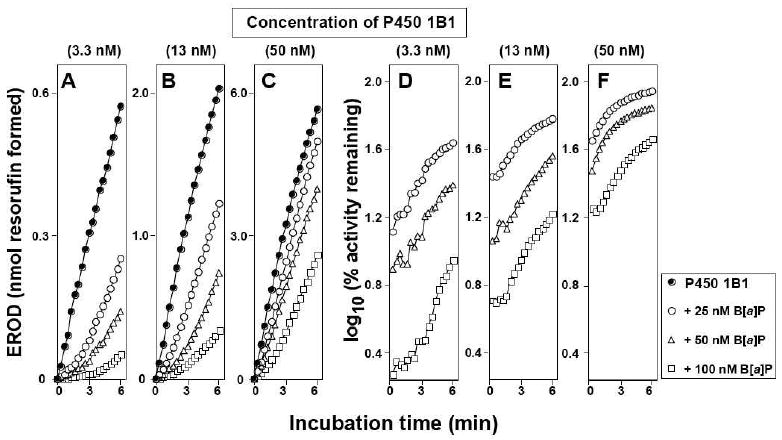
Figure 2.

Dependence of inhibition of P450 1B1-supported EROD activity by B[a]P on incubation time. P450 1B1, at concentrations of 3.3 nM (parts A and D), 13 nM (parts B and E), and 50 nM (parts C and F) was used without B[a]P (closed circles in parts A, B, and C, ●), 25 nM B[a]P (open circles, ○), 50 nM B[a]P (open triangles, Δ), and 100 nM B[a]P (open squares, □). Reactions were done at 37 °C. Formation of resorufin was monitored as a function of incubation time in parts A, B, and C, and the effects of B[a]P were determined as log10 (% activity remaining) in parts D, E, and F.
